July 2024 climate report
6 Aug 2024, 12:00 PM
Summary
- ENSO continues to be in neutral conditions, but La Niña conditions are intensifying with time.
- August – October is expected to be warmer than average, with near average rainfall.
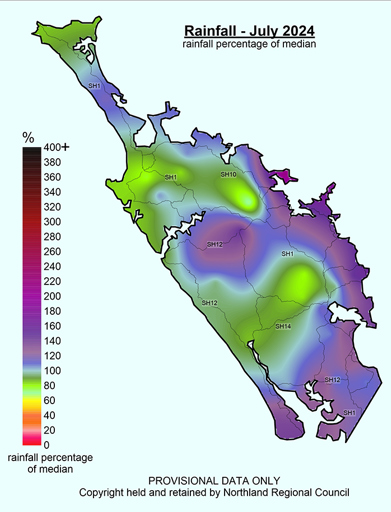
- Rainfall in July was on average greater than expected, with 111% recorded for Northland.
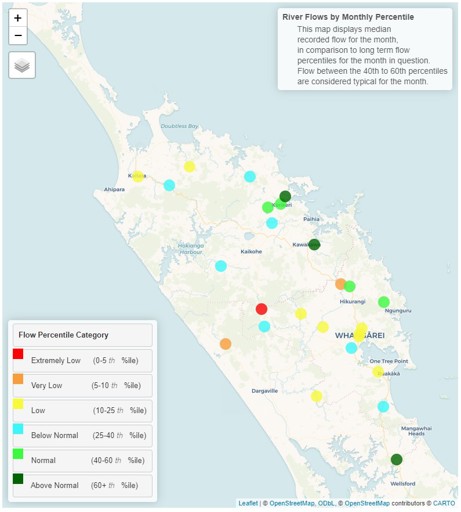
- River flows in July were mostly below average for the region, except for the catchments on the east coast.
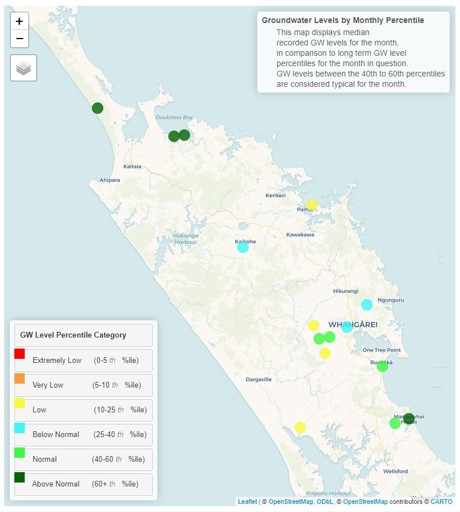
- Ground water levels were above average in the far north and south of the region, while the central aquifers were below normal.
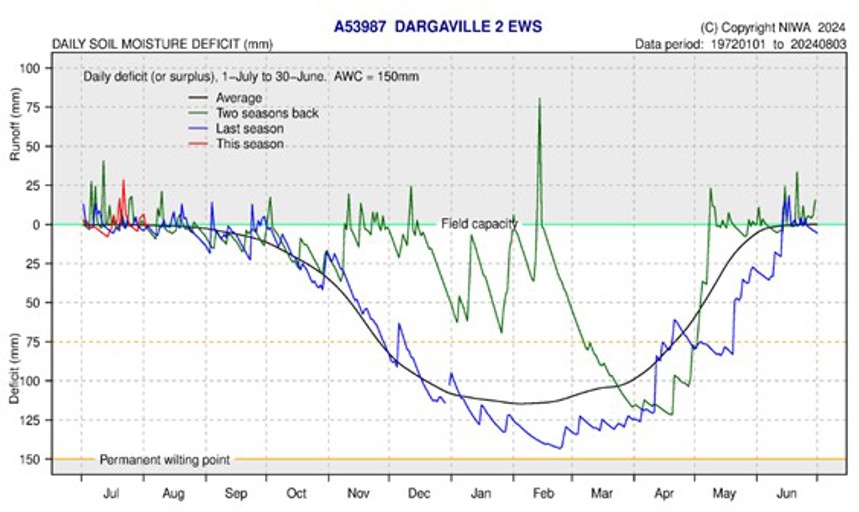
- Soil moisture for all of Northland is at or just below field capacity at the end of July.
Climate Outlook for August – October 2024
New Zealand continues in a La Niña watch, which has a 60% chance of developing in spring, and which is showing signs of intensifying.
The Madden Julian Oscillation is expected to drive near or below average temperatures and reduced rainfall in August in Northland. But this will likely transition to the east in September and propagate warmer and wetter air flows across northern New Zealand.
In Northland, following a cold snap in the first two weeks of the month, temperatures are likely to be “Above Average” for August – October. Rainfall is likely to be “Near Average”, as are soil moisture levels. River flows are likely to be “Below average”.
For more details, please refer to NIWA’s seasonal climate outlook for August – October 2024:
NIWA Temperature, Rainfall, Soil Moisture and River Flows probabilities for the period of August – October 2024
(Expressed as % likelihood for either Above Average, Near Average or Below Average conditions).
| Temperature | Rainfall | Soil moisture | River flows | |
| Above average | 55• | 35 | 25 | 10 |
| Near average | 40 | 40• | 45• | 40 |
| Below average | 05 | 25 | 30 | 50• |
Rainfall
The first half of July was particularly dry, with only scattered showers, but from the 15th to the end of the month, several rain bands moved across the region. Northland averaged just under 200mm regionally for July.
The lowest rainfall was around the Kai Iwi/Dargaville/Ruawai area with 120-130mm while greatest falls were in the hills above Waimamaku (336.5mm) and inland of Ngunguru (301.5mm).
Percentage wise, the region averaged 111% making it wetter than usually expected for July. The rainfall in the region was focused on the east coast and moved into the Kaikohe area from there. However, some areas in the far north and south of the region were also particularly wet.
Rainfall (% of Median) for July 2024 across Northland with an average of 11%
Standardised Precipitation index (SPI)
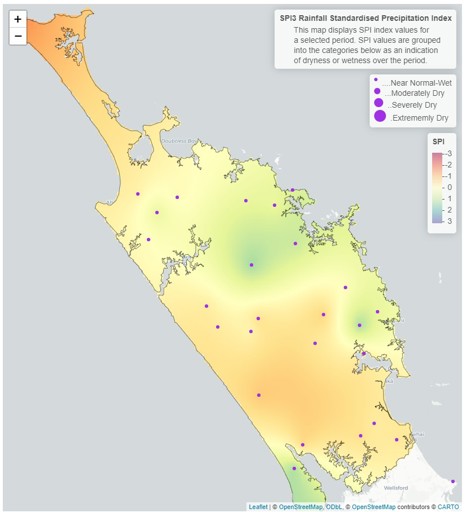
The Standardised Precipitation Index (SPI) averages the rainfall recorded at each site, for the time, then places it on a scale of -3 to +3, where 0 is “Normal” for the area. This allows for better comparison between different parts of the region and through time.
On a three-month scale, SPI3, between May – July 2024, the region is “Near Normal” – “Wet”, with the wettest areas around Kaikohe and Kaeo, and the western side of the region becoming drier.
On a six-month scale between February and July 2024 Northland is highly varied, with some areas being “Near Normal”, while distinct areas are “Moderately – Severely Dry”.
3-month (May - July 2024) and 6-month (February - July 2024) SPI maps
River flow
Average river flows in Northland for June ranged from “Below Normal” to “Very Low” for most of the region. The Bay of Islands, and other eastern catchments, however had “Normal” or “Above Normal” flows, which will have been driven by the rainfall patterns that were predominantly from the east, experienced in July.
River flows in key catchments for July 2024
Groundwater
Water levels at key aquifers in Northland during July, the far north has shown the greatest recovery with aquifers recording “above normal” water levels, which is similar to the far south of Northland. While the central part of the region is currently recording “below normal” or “low” water levels for July. The Russell aquifer has shown some improvement compared to previous months record.
| Aquifer | Status | Percentile |
| Aupōuri | Above normal | 60th+ |
| Taipā | Above normal | 60th+ |
| Russell | Low | 10th-25th |
| Kaikohe | Below normal | 25th-40th |
| Poroti | Below normal | 25th-40th |
| Whangārei | Below normal | 25th-40th |
| Mangawhai | Above normal | 60th+ |
| Marsden - Ruakākā | Normal | 40th-60th |
| Ruawai | Low | 10th-25th |
Ground water levels in key aquifers for July 2024
Soil Moisture
Soil moisture in July remained at field capacity, with a number of runoff events of varying intensity across monitoring sites in Northland.
The soil moisture deficit is calculated based on incoming daily rainfall (mm), outgoing daily potential evapotranspiration (mm), and a fixed available water capacity (the amount of water in the soil 'reservoir' that plants can use) of 150 mm” (NIWA).

