November 2024 climate report
11 Dec 2024, 10:30 AM
Key takeaway
Low Spring rainfall for Northland has resulted in lower-than-normal river flows and groundwater levels for the region heading into summer.
Summary
- Northland region averaged 71% of normal expected rainfall for November, and 70% of normal rainfall for the three months of Spring. Most of Northland ranges from “moderately dry” to “severely dry” on the standardised precipitation index (SPI).
- River flows and groundwater levels through Northland primarily range from “below normal” to “very low” (40th to 5th percentiles) for November.
- There is low confidence of La Nina being officially declared, however, other key climate drivers in New Zealand are trending towards driving La Niña like conditions around Northland as the summer progresses, and this brings increased probability for more frequent rain events from the new year.
- There is an increased risk for tropical or subtropical cyclones north of the country from mid-December.
- Temperatures are very likely to be above average (65% chance) over the next three months.
- Rainfall totals are about equally likely to be near normal (40% chance) or above normal (40% chance) over the next three months.
- Soil moisture levels are most likely to be below average (45% chance) over the next three months.
- River flows are equally likely to be near normal (40% chance) or below normal (40% chance) over the next three months.
- Northland is currently in a moderate level of meteorological drought (low rainfall) and a low level of hydrological drought (low river flows, groundwater levels, and reservoir levels etc.). There is a risk that, if extended periods of low rainfall continue, Northland could experience an increasing level of hydrological drought (lower river flows, groundwater levels and water reservoirs etc.) over the next three months.
Rainfall
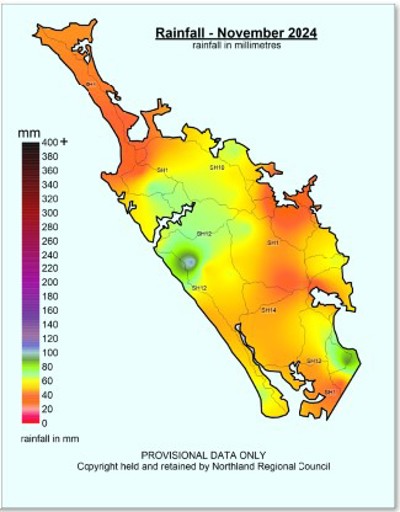
- Northland averaged 54mm of rainfall across the region for November, which is 71% of the median, or normal expected rainfall.
- The highest rainfall total for the month was recorded at Waimamaku at Wekaweka road in the South Hokianga with 107mm.
- Poutō Peninsula recorded the highest percentage of median with 120% of normal expected rainfall.
- Ōpua in the BOI recorded the lowest rainfall total for the month with 24.5mm.
- The lowest percentage of median was recorded at the Tarawhataroa at Larmer Road, Kaitaia, with 40% of normal expected rainfall.
- Northland region averaged 70% of median, or normal expected, rainfall for the three months of Spring.
- The southern end of the Poutō Peninsula recorded 112%, the only area to record more rainfall than normally expected for Spring.
- The lowest percentage for Spring was recorded at the Waiharakeke at Okaroro Road, south of Kawakawa, with 49% of normal expected rainfall.
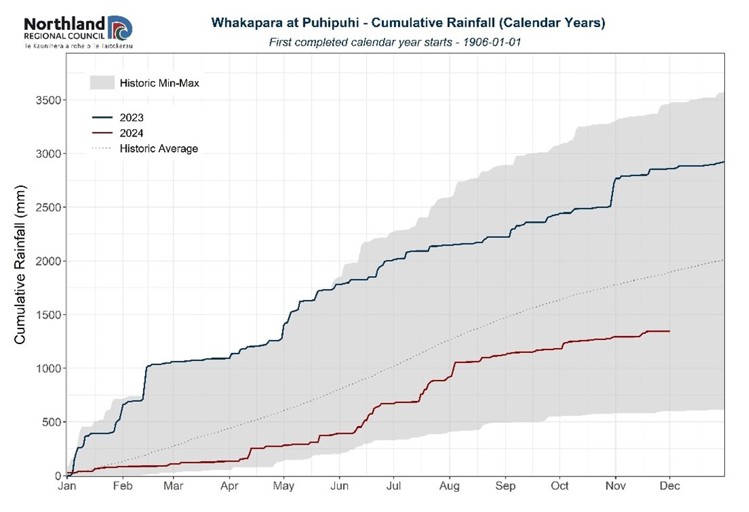
- The cumulative rainfall total (Figure 3) recorded at the Whakapara at Puhipuhi (with Northland’s longest continuous rainfall record), for the 2024 calendar year to the end of November, shows that annual rainfall is tracking well below the historic average.
- The three-month Standardised Precipitation Index (SPI) (Figure 4) from September to November shows that most of the region ranges from “moderately dry to severely dry”. With only the Poutō Peninsula being “near normal – wet”.
River flows
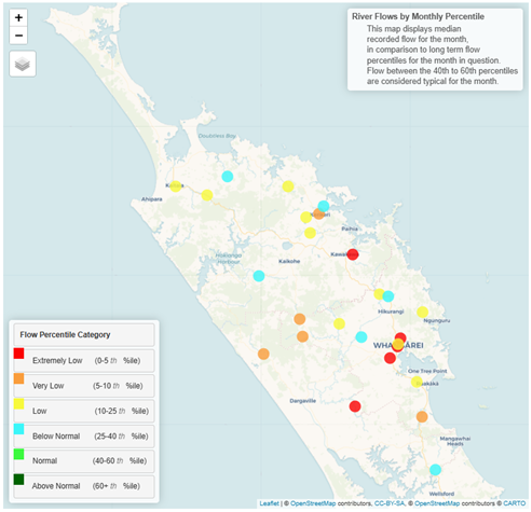
- River flows in most of Northland’s primary monitored catchments ranged from “below normal” to “very low” for November, and some are now “extremely low” for this time of year.
- These low flows are reflective of the low rainfall recorded for the month, and through Spring.
- Most river flows remain above Mean Annual Low Flow (MALF) but several are now below or very close to MALF including the Waiarohia and Raumanga in Whangārei, the Otaika, south of Whangarei, and the Ahuroa in Bream Bay.
Groundwater
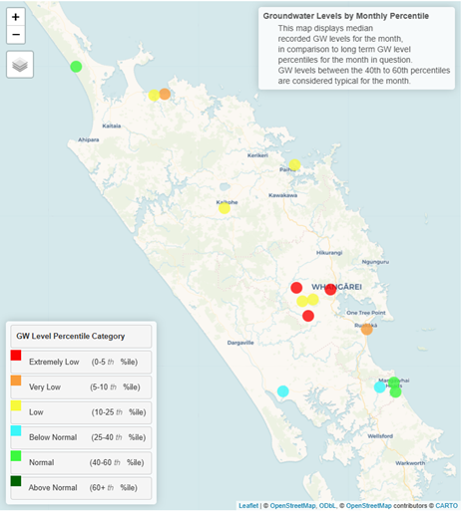
- Groundwater levels in Northland's primary monitored aquifers ranged from normal to extremely low for November.
- This variation is due to rainfall distribution through the region, and aquifer characteristics.
Climate Outlook for December 2024 – February 2025
Summary of climate forecasts from NIWA and MetService
There is low confidence of La Nina being officially declared, however other key climate drivers in New Zealand are trending towards driving La Nina like conditions around Northland as the summer progresses, and this brings increased probability for more frequent rain events from the new year. There is also an increased risk for tropical or subtropical cyclones north of the country from mid-December.
Table 1: Forecasted likelihood of above, near or below average climate conditions for Northland from December 2024 – February 2025
(Expressed as % likelihood for either Above Average, Near Average or Below Average conditions).
| Temperature | Rainfall | Soil moisture | River flows | |
| Above average | 65• | 40• | 15 | 20 |
| Near average | 30 | 40• | 35 | 40• |
| Below average | 05 | 20 | 45• | 40• |
- Temperatures are very likely to be above average (65% chance).
- Rainfall totals are about equally likely to be near normal (40% chance) or above normal (40% chance) for the summer season as a whole. Heavy rainfall events cannot be ruled out.
- Soil moisture levels are most likely to be below average (45% chance).
- River flows are equally likely to be near normal (40% chance) or below normal (40% chance).
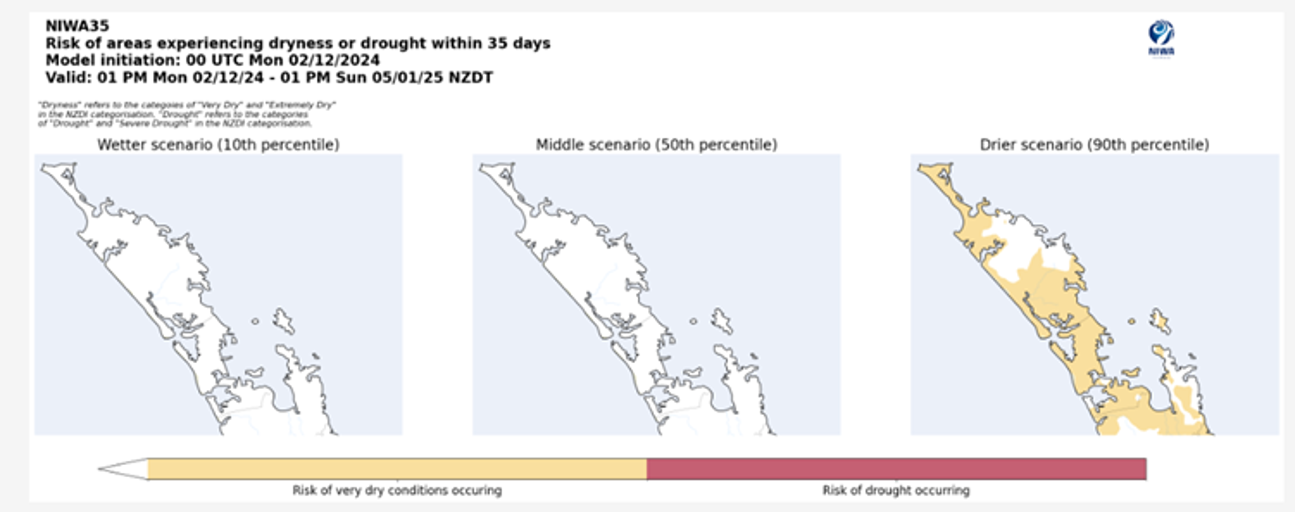
NIWA’s drought prediction tool combines rainfall, soil moisture, and evapotranspiration to estimate the risk of meteorological drought, over the next 35 days. The forecast starting on the 2/12/2024 shows a small risk (90th percentile) of very dry conditions occurring (Figure 7). However, the NIWA35 rainfall average prediction is that Northland will receive 50 – 80% of the expected rainfall for December (Figure 8).
For more details, please refer to NIWA’s seasonal climate outlook for December 2024 - February 2025:
- Seasonal climate outlook on NIWA's website: niwa.co.nz
- Weather email lists on Metservice's website: metservice.com
- The NIWA35 forecasting tool can be re-run every week, and is most reliable for the two weeks after the forecast: NIWA35 forecasting tool
NIWA New Zealand Drought Index Map
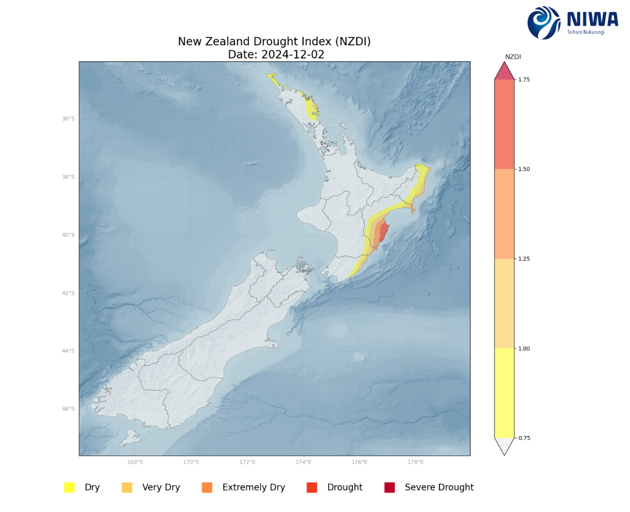
As of 2 December, a large portion of Northlands east coast, and the Aupouri Peninsular, is registered as dry on NIWA’s NZ Drought Index map (Figure 9) which is based on the Standardised Precipitation Index, the Soil Moisture Deficit, the Soil Moisture Deficit Anomaly, and the Potential Evapotranspiration Deficit.
Drought Risk Assessment
Table 2: Drought Risk assessment matrix
| Current conditions | Extreme | Very low | Low | Normal | High | Very high | Extreme |
| Rainfall | |||||||
| SPI maps | |||||||
| River flows | |||||||
| Groundwater levels | |||||||
| Soil moisture data not available | |||||||
| Water resources current state | |||||||
| NIWA 3-month outlook | |||||||
| NIWA drought index | |||||||
| MetService December forecast |
The drought risk assessment (table 3) provides a visual summary of the current conditions of Northland's rainfall, river flows, and groundwater levels and the current state of water resources as a whole. It also incorporates NIWA’s Climate Outlook and Drought Index, and MetService Forecasts.
In summary, the Northland region has experienced lower than normal rainfall for the 2024 calendar year, and this has continued through Spring. As a consequence, most river flows and groundwater levels through the region are currently lower than normal for this time of year.
NIWA’s climate outlook for summer predicts rainfall to be normal to above normal, river flows to be about normal to below normal, and soil moisture below normal, over the next three months. There is a possibility for more northerly rainfall events in mid-December.
Northland is currently in a moderate level of meteorological drought (low rainfall) and a low level of hydrological drought (low river flows, groundwater levels, and reservoir levels etc.). There is a risk that, if extended periods of low rainfall continue, Northland could experience an increasing level of hydrological drought (lower river flows, groundwater levels and water reservoirs etc.) over the next three months.
Tropical Cyclone Outlook
Summary of NIWA and MetService Outlooks
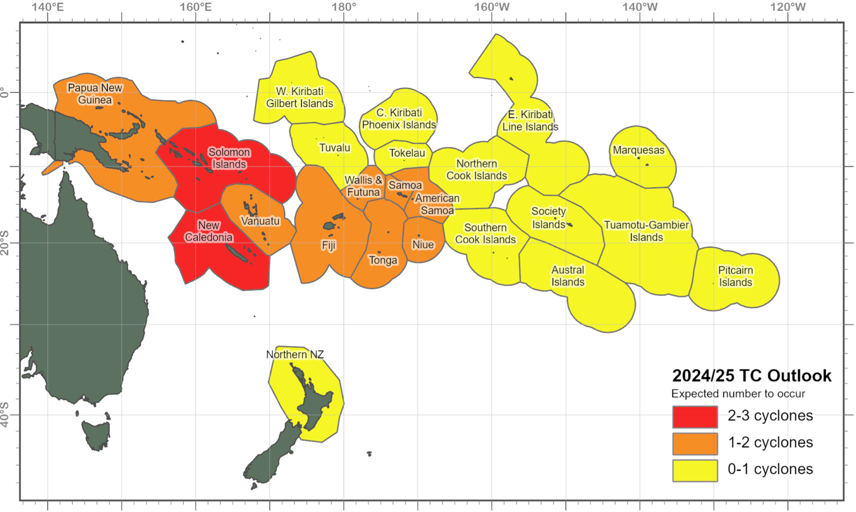
On average at least one ex-tropical cyclone (TC) passes within 550km of New Zealand (NZ) each year. This season the risk is considered normal-elevated. If an ex-TC tracks close to NZ, there is a near equal probability of it racking to the east or west of the North Island. An ex-TC entering the NZ region could produce significant rainfall, severe winds, hazardous marine conditions and coastal damage.

