June 2024 climate report
8 Jul 2024, 12:00 PM
Summary
- ENSO continues to be in neutral conditions, this could change to La Niña in Spring.
- July – September is expected to be warmer than average, with average rainfall.
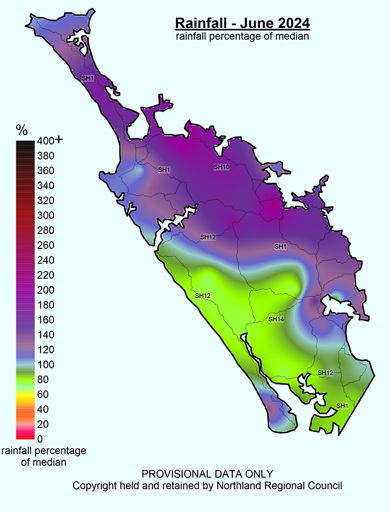
- June rainfall was 121% of expected for Northland, however this was concentrated in the North and East.
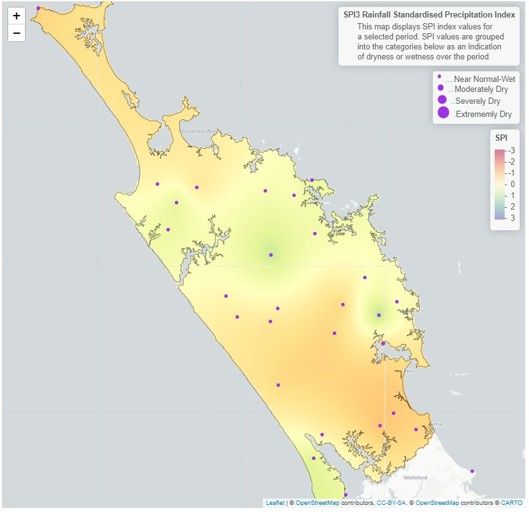
- Standardising the precipitation on a three month scale shows the region to be near normal for rainfall, but moderately dry on a six month scale.
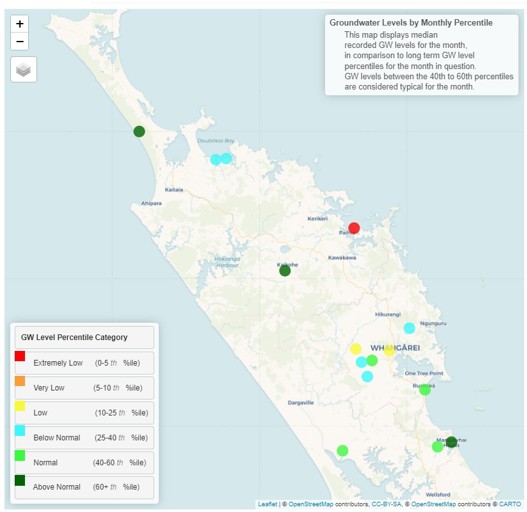
- Ground water for June ranges from “Low” to “Above Normal” in Northland, with no obvious pattern for why.
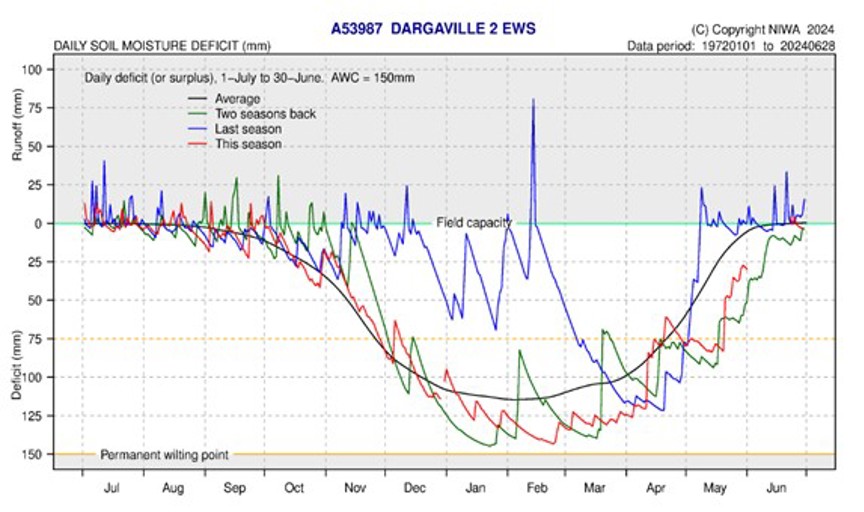
- Soil Moisture moving into July is at or just below field capacity.
Climate Outlook for July – September 2024
New Zealand continues to be influenced by neutral ENSO conditions. The Sea Surface Temperatures (SST) in the central Pacific Ocean had a slight warming trend, while the eastern Pacific contrasted with trends of cooling temperatures. This adds strength to a potential shift to La Niña in Spring.
Current models show a 60-70% chance of a moderate La Niña at the end of 2024. The Madden Julian Oscillation is expected to drive low pressure and rain fall across Northland at the end of July, while will transition into a drier, high-pressure August and September.
In Northland temperatures are likely to be “above average” for July – September, and frosts are highly unlikely due to low likelihood of southerly winds. Rainfall is likely to be “near average”, as are soil moisture levels. River flows are likely to be “Below average”.
For more details, please refer to NIWA’s seasonal climate outlook for July – September 2024:
NIWA Temperature, Rainfall, Soil Moisture and River Flows probabilities for the period of July to September 2024
(Expressed as % likelihood for either Above Average, Near Average or Below Average conditions).
| Temperature | Rainfall | Soil moisture | River flows | |
| Above average | 50• | 25 | 05 | 10 |
| Near average | 45 | 45• | 50• | 40 |
| Below average | 05 | 30 | 45 | 50• |
Rainfall
June was the wettest month to date for 2024, however the rainfall for the region showed a clear divide between the North East, and South West. On average Northland recorded 190 mm, which was 121% of the expected rainfall. The highest totals were recorded in the northeast, with Touwai above the Whangaroa Harbour top scored with 353.5mm followed by the Waitangi at Wiroa Road (316.5mm) and Kaeo (315mm). The Lowest monthly rainfalls recorded in the southern areas of the region were Kai Iwi Lakes with 85mm followed by Ruawai (95.5mm) and Poroti- east of Whangārei (103mm).
Rainfall (% of Median) for June 2024 across Northland with a range of 74% to 221%
Standardised Precipitation index (SPI)
The Standardised Precipitation Index (SPI) averages the rainfall recorded at each site, for the time, then places it on a scale of -3 to +3, where 0 is “normal” for the area. This allows for better comparison between different parts of the region and through time.
On a three-month scale, SPI3, between April – June 2024, the region is “near Normal” – “wet”, with the wettest areas around Kaikohe and Kaeo. On a six-month scale between January and June 2024 most of the regions is “moderately dry".
3-month (April - June 2024) and 6-month (January - June 2024) SPI maps
River flow
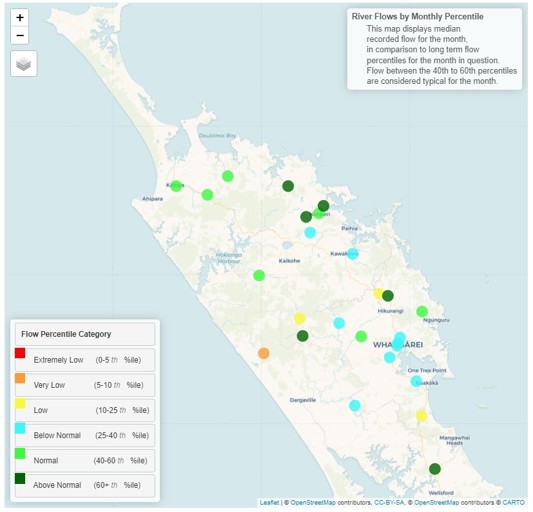
Average river flows in Northland for June ranged from “Below Normal” to “Very Low” in the southern part of the region. While North of the Mangamuka ranges the flows with either “normal” for June, or “above normal”.
River flows in key catchments for June 2024
Groundwater
Water levels at key aquifers in Northland during June was varied with no particular pattern. Most sites were either “Below Normal” or “Normal”. Russel continues to be “Extremely Low”.
| Aquifer | Status | Percentile |
| Aupōuri | Above normal | 60th+ |
| Taipā | Below normal | 25th-40th |
| Russell | Extremely low | 0-5th |
| Kaikohe | Above normal | 60th+ |
| Poroti | Below normal | 25th-40th |
| Whangārei | Low | 10th-25th |
| Mangawhai | Above normal | 60th+ |
| Marsden - Ruakākā | Normal | 40th-60th |
| Ruawai | Normal | 40th-60th |
Ground water levels in key aquifers for June 2024
Soil Moisture
Soil moisture finished June at field capacity for all monitored sites. There are gaps in the data due to missing interpolation data for the month of June, however the rainfall patters through the month, would have brought the levels up slowly. A small deficit will hopefully form leaving room for winter rain to come in July.
The soil moisture deficit is calculated based on incoming daily rainfall (mm), outgoing daily potential evapotranspiration (mm), and a fixed available water capacity (the amount of water in the soil 'reservoir' that plants can use) of 150 mm” (NIWA).

