May 2024 climate report
11 Jun 2024, 10:00 AM
Summary
- The ENSO is now in a neutral state, there is a possibility that La Niña will develop in spring.
- Northland can expect large amounts of variability in climate for winter, however on average temperatures will be “near or above average”, and rainfall will be “near or below average”.
- Rainfall in May was below expected, with Northland receiving 75% of the recorded average.
- River flows are “below normal” to “extremely low” through out Northland, with no pattern to the affected catchments.
- Ground water levels in key aquifers range between “below normal" and “above normal".
- Soil moisture levels are generally below average, with only Kaikohe sustaining field capacity during May and the start of June. Other sites are still in a deficit.
Climate Outlook for June – August 2024
El Niño which has been driving the weather in Northland since March has now ended, the ENSO has eased into neutral conditions, with 60 -70% chance of La Niña developing during spring. May across New Zealand was 1 – 2°C cooler than May 2023, with mostly dry weather.
Winter in the north is expected to be dominated by high pressure and westerly winds, however with no predominant climate driver in force, typical winter variability is likely. In Northland between June – August, temperatures are likely to be near average or above average, with cooler possibly frosty mornings and warm afternoon temperatures. Rainfall is likely to be near average or below average, with irregular rainfall events throughout the season.
Soil moisture and river flows are directly affected by rainfall and are likely to be either below or near average. The rainfall anomaly for June, modelled by NIWA, predicts that throughout June some of Northland with be “dry” Receiving 80% or less rainfall than expected in June.
For more details, please refer to NIWA’s seasonal climate outlook for June - August 2024:
NIWA Temperature, Rainfall, Soil Moisture and River Flows probabilities for the period of June to August 2024
(Expressed as % likelihood for either Above Average, Near Average or Below Average conditions).
| Temperature | Rainfall | Soil moisture | River flows | |
| Above average | 45• | 25 | 10 | 10 |
| Near average | 40• | 35• | 45• | 40• |
| Below average | 15 | 40• | 45• | 50• |
NIWA Rainfall anomaly for June 2024
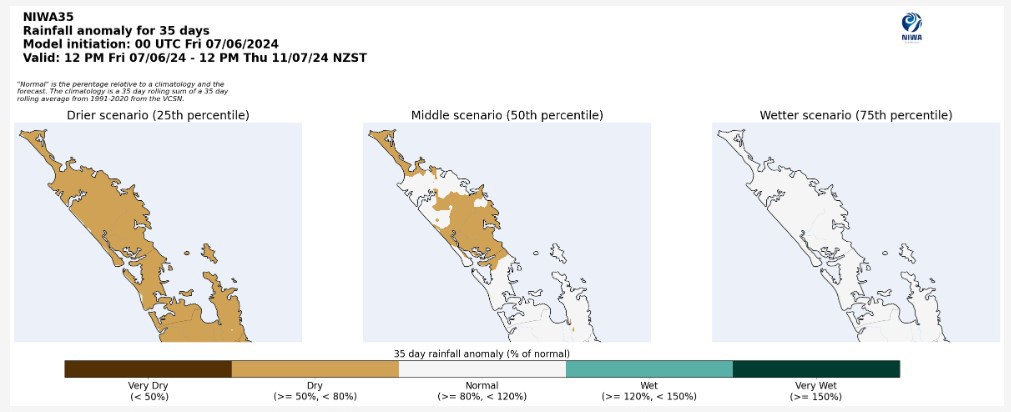
NIWA35 Rainfall model which combines rainfall to average rainfall for the area showing what is expected between 7 June and 11 July 2024.
Rainfall
Northland received an average of 112 mm of rainfall throughout May, which was 75% of the expected May total. The rainfall was generally particularly light, with two small storms in the third and fourth week bringing the totals up. The maximum recorded was in Waimamaku with 283 mm (112%). Rotokakahi, Opouteke and Tutamoe rain gauges also recorded just over 100% of the expected rainfall for their respective sites. The minimum rainfall was recorded at Cape Reinga with 46 mm (40%), followed by Waitangi at McDonald with 68 mm (45%).
Rainfall (% of Median) for May 2024 across Northland with a range of 40% to 112%

Standardised Precipitation index (SPI)
The Standardised Precipitation Index (SPI) averages the rainfall recorded at each site, for the time, then places it on a scale of -3 to +3, where 0 is “normal” for the area. This allows for better comparison between different parts of the region and through time.
On a three-month scale, SPI 3, between March – May 2024, the east coast generally “moderately dry” while the west coast is generally “near normal”. On a six-month scale between December 2023 and May 2024 the east coast is “severely dry”, while the west of Northland ranges between “moderately dry" and "near normal”.
3-month (March - May 2024) and 6-month (December 2023 – May 2024) SPI maps


River flow
Average river flows in Northland for May ranged from “Below Normal” (25 – 40% of expected) to “Extremely Low” (5% of expected). The flows in Bream Bay were the highest (Below Normal), otherwise there was no pattern between catchments.
(The monthly percentile river flows graphic for May 2024 is unavailable due to technical issues.)
Groundwater
Water levels at key aquifers in Northland ranged between “Below Normal” (25 – 40% of expected) and “Above Normal” (> 60%) in May. With the north and south edges of the region having the highest water levels, and lower levels in more central aquifers. Russell aquifer is the outlier to this pattern, with the continuous bore water levels for May being 5% of expected, however this level is above the trigger point for concern.
| Aquifer | Status | Percentile |
| Aupōuri | Above normal | 60th+ |
| Taipā | Normal | 40th-60th |
| Russell | Extremely low | 0-5th |
| Kaikohe | Below normal | 25th-40th |
| Poroti | Below normal | 25th-40th |
| Whangārei | Below normal | 25th-40th |
| Mangawhai | Above normal | 60th+ |
| Marsden - Ruakākā | Normal | 40th-60th |
| Ruawai | Below normal | 25th-40th |
(The groundwater graphic for May 2024 is unavailable due to technical issues.)
Soil Moisture
Through May soil moisture levels slowly recovered as rainfall increased, however the west coast, the Far North and Whangārei are still below average and have approximately a 30mm deficit.
Moving into June we would expect that soil moisture levels were at field capacity, only Kaikohe is currently stable at field capacity while Kerikeri and Warkworth are sitting just below.
The soil moisture deficit is calculated based on incoming daily rainfall (mm), outgoing daily potential evapotranspiration (mm), and a fixed available water capacity (the amount of water in the soil 'reservoir' that plants can use) of 150mm (NIWA).


