April 2024 climate report
6 May 2024, 10:00 AM
Summary
- El Niño is expected to end by the end of May in be in neutral conditions during Winter.
- Temperature for May – July is expected to be “near average” or “above average”.
- Rainfall, soil moisture and river flows are expected to be “below average” for the next three months.
- On average, Northland received 95% of the expected April rainfall.
- Standardised rainfall over a 3-month period shows that most of the region is “moderately – severely dry”.
- River Flows in April are “low” or “below normal” for Northland.
- Ground Water levels are either “low” or “below normal” for majority of Aquifers in Northland.
- Soil Moisture in most areas of Northland remain in a deficit. Currently only Kaikohe was at field capacity at the end of April.
Climate outlook for May to July 2024
The end of Autumn is set to be cooler than usual, however June and July are expected to be milder with winds transitioning from southerlies to predominantly westerlies as we move into Winter. El Niño has continued to ease throughout April and is expected to be classified as neutral ENSO conditions by the end of May. La Niña is expected to develop in Spring, though we can’t predict how strong that will be yet. A large climatic cell is developing in the Pacific and will reduce the number of low-pressure systems passing over New Zealand. This will likely result in below normal rainfall in Northland with irregular rainfall events. Soil moisture is also expected to remain in deficit while river levels remain low.
For more details, please refer to NIWA’s seasonal climate outlook for May - July 2024:
NIWA Temperature, Rainfall, Soil Moisture and River Flows probabilities for the period of May to July 2024
(Expressed as % likelihood for either Above Average, Near Average or Below Average conditions).
| Temperature | Rainfall | Soil moisture | River flows | |
| Above average | 40• | 20 | 10 | 10 |
| Near average | 40• | 35• | 40 | 40 |
| Below average | 20 | 45• | 50• | 50• |
The drought forecasting tool (NIWA35) will be highly useful for getting a better understanding of what to expect as the ENSO variation and unpredictability continues.
During May the New Zealand Drought Index model (NZDI) predicts “very dry” conditions in small pockets of the Far North for the driest scenarios. The New Zealand Drought Index model (NZDI) combines rainfall, soil moisture and evapotranspiration. Rainfall modelled for the next 35 days compared to previous years shows majority of Northland to be “Dry” with a small chance that the region will be “very dry” for May.
This tool can be accessed, and rerun daily at: shiny.niwa.co.nz/drought-forecast
NIWA35 NZDI model which combines Rainfall, soil moisture and evaporation for 29-4-2024 – 2-6-2024
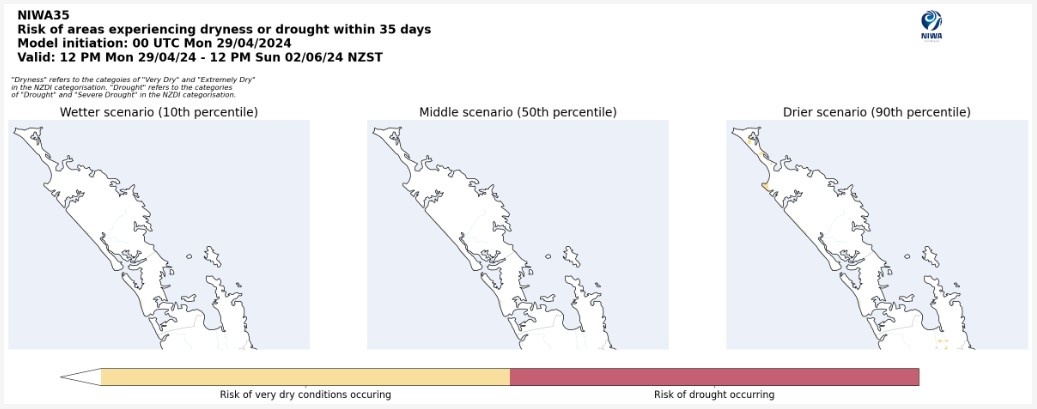
NIWA35 NZDI model which combines Rainfall, soil moisture and evaporation for 29-4-2024 – 2-6-2024.
NIWA35 Rainfall model which combines Rainfall to average rainfall for the area showing what is expected between 29-4-2024 – 2-6-2024

NIWA35 Rainfall model which combines Rainfall to average rainfall for the area showing what is expected between 29-4-2024 – 2-6-2024.
Rainfall
April rainfall in Northland averaged out at 93.5 mm recorded, which was just below normal (95%) compared to the historical record. The rainfall was predominantly from the west, with the highest ranges receiving the most rainfall, with, 193.5mm at Waimamaku in the south Hokianga, followed by the more central Kaikohe with 177.6mm, and 148.5mm at Puhipuhi north-east of Whangārei.
The lowest amounts were recorded in the Far North and the low-lying areas around Whangārei, with Waipao near Mangakahia just west of Whangārei (51.5mm) recording the least. Followed by 61.5mm at Oruru near Taipa and 62mm at Cape Reinga.
In relation to the percentage of the median for each area the Hokianga at Omapere/Opononi had the highest percentage at 185% followed by 165% at Ruawai while the lowest was at Kerikeri with 59% of the usual April rainfall and 60% at Topu B near Waima in the southern Hokianga.
Rainfall (% of Median) for April 2024 across Northland with a range of 59% to 185%


Standardised Precipitation index (SPI)
Continued “below normal” rainfall between February – April has had a noticeable effect across Northland, the Standardised Precipitation Index (SPI) on a three-month scale, shows that the north east of the region is “extremely dry” while the rest of the east and central parts of Northland are “moderately dry” to “severely dry”.
The west coast particularly through the Hokianga is “near normal” as is the Poutō Peninsular. As majority of the weather systems from the El Niño come from the west the pattern is well explained. On a six-month scale between November 2023 – April 2024, the rainfall average pattern is similar however with less extremes in the severity, compared to the three months index.
3-month (February - April 2024) and 6-month (November 2023 – April 2024) SPI maps


River flow
River flows across Northland catchments in April were predominantly “low” or “very low”, in some areas to the north and south of the region some catchments were in better shape with recorded flows “below normal”. These levels are likely to continue unless rainfall amounts unexpectedly increases.
Monthly percentile River Flows for April 2024


Groundwater
Across Northland aquifers, there is large amount of variation in water levels. Ranging from “Normal” to “Extremely Low”.
| Aquifer | Status | Percentile |
| Aupōuri | Above normal | 60th+ |
| Taipā | Normal | 40th-60th |
| Russell | Very low | 5th-10th |
| Kaikohe | Low | 10th-25th |
| Poroti | Below normal | 25th-40th |
| Whangārei | Below normal | 25th-40th |
| Mangawhai | Above normal | 60th+ |
| Marsden - Ruakākā | Below normal | 25th-40th |
| Ruawai | Below normal | 25th-40th |
Doubtless Bay and Mangawhai are in better condition with “normal” to “above normal” water levels for April.
Groundwater levels for March 2024


Soil Moisture
Soil Moisture levels for April continued to generally be below average, particularly in the south and east of the region. The variation here is at Kaikohe where after higher-than-average rainfall, moisture levels have recovered to field capacity, all other sites move into May with a deficit.
Soil moisture deficit is calculated based on incoming daily rainfall (mm), outgoing daily potential evapotranspiration (mm), and a fixed available water capacity (the amount of water in the soil 'reservoir' that plants can use) of 150 mm” (NIWA).


