October 2024 climate report
8 Nov 2024, 3:00 PM
Key takeaway
Close to normal rainfall for Northland in October, but a drier than normal 2024 to date.
Summary
-
Northland received on average 101% of the expected rainfall for the region in October, however catchments ranged from 64% - 182%. Lower-than-expected rainfalls through winter and early spring have resulted in “moderately dry” conditions on a three- and six-month scale in the Standardised precipitation index for the majority of Northland.
-
River flows and Groundwater levels are predominately “low” or “very low” (5th – 25th percentiles) for October.
-
Soil Moisture is about average at all sites in Northland for October, with about 25 mm of deficit. The decreasing trend is likely to continue unless there is significant rainfall in the coming months.
-
There is a 50% chance of La Nina developing; however, it is likely to be mild and short lived.
-
There is some likelihood of rainfall at the end of November if the Madden-Julian Oscillation and Indian Ocean Dipole climate drivers continue to develop and converge.
-
Temperatures are most likely to be above average over the next three months.
-
Rainfall is about equally likely to be average, or below average over the next three months.
-
Soil Moisture is about equally likely to be average, or below average over the next three months.
-
River Flows is about equally likely to be average, or below average over the next three months.
-
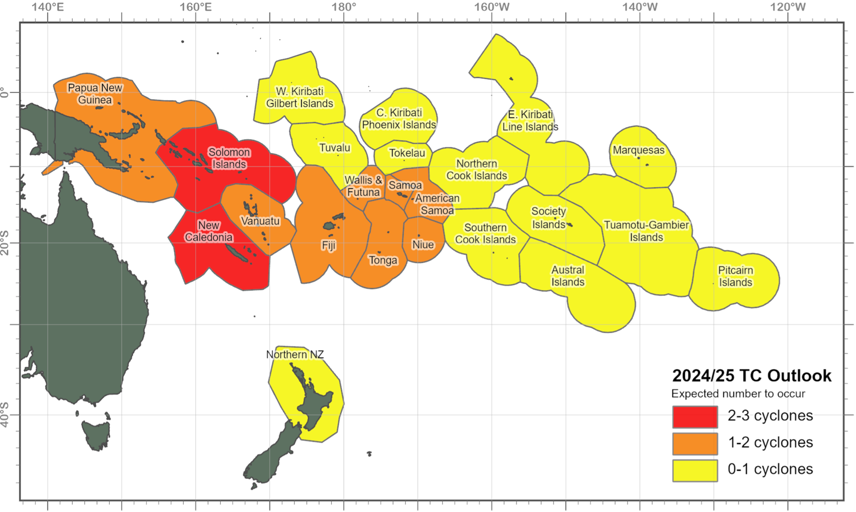
The NIWA and MetService tropical cyclone (TC) risk assessments indicate that the risk of an ex-TC passing within 550km of New Zealand is normal-elevated.
Northland in October
Rainfall
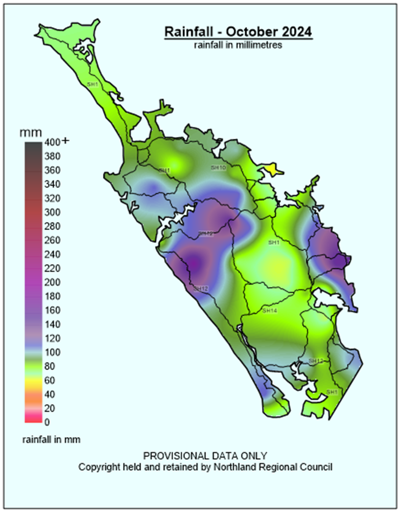
As expected, we had another typical spring month in October with periods of rain, wind and fine weather. The wettest day was the 2nd of October and the majority of rain for most sites was during the first week (Figure 1). Bands of rain swept over Northland through much of the month with dryer days in between. There were no significant weather events to report for October in Northland.

From the maps below you will note that they are largely green (a bit under average) through to purple ( a bit above average). Nothing too extreme. Greatest monthly falls were recorded at Waimamaku at Wekaweka Road with 173mm followed by 155.5mm at Ngunguru at Dugmores Rock. Least rainfall was recorded at Whangarei airport with 60.1mm followed by Purerua Peninsula, Northern Bay of Islands with 60.6mm. The whole region averaged 93.6mm for October 2024. In terms of percentages of the median, or the percentage of what you would normally expect in the month, the maximum recorded was 182% at Ngunguru at Dugmores Rock, then 150% at Kaikohe. Lowest percentages were at Te Puhi at Mangakawakawa Trig near the Mangamuka range in the Far North with 62% and 64% at Waiharakeke at Okaroro Road south of Kawakawa. All up, The Northland region came in with 101% of median – so that’s pretty close to the expected – however it wasn’t spread evenly over the region.
Despite the month being around average for October rainfall, many sites are still tracking along on the cumulative rainfall graphs at a low trajectory, near historic low levels, in stark contrast to last year. Figure 3 shows the accumulation distribution for Hatea at Glenbervie Forest, west of Whangarei, which is the typical picture for all Northland sites. The Standardised Precipitation Index model presents the accumulation of rainfall in relation to the sites own median allowing all rainfall sites to be compared with each other. The Northland region is particularly dry coming out of winter and spring, with the three-month SPI (Figure 4) from August to October recording majority of the region as “moderately – severely dry”. With only the Pouto Peninsula being “near normal – wet”. A very similar pattern is seen on a six-month scale as well. However please note the Aupōuri Peninsula is likely to also be closer to “normal” or “moderately dry” but is currently being artificially affected by the Cape Reinga faulty gauge.

Soil Moisture
Data provided by NIWA.
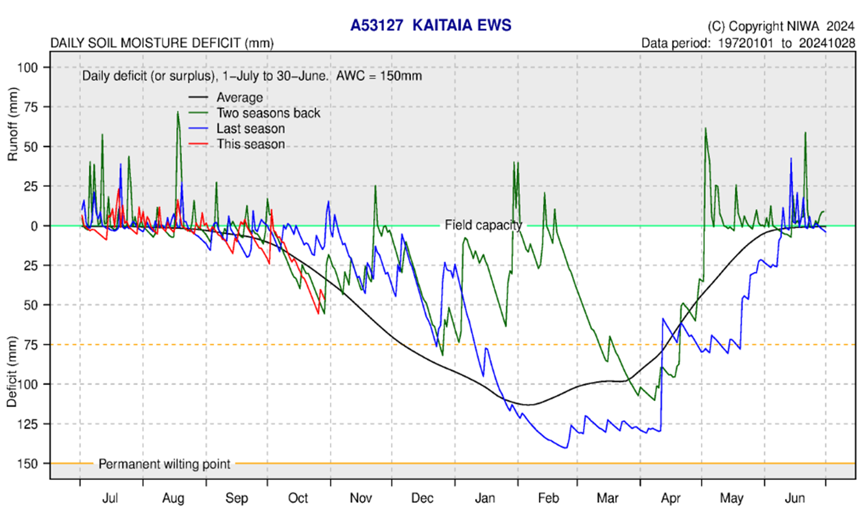
Across Northland Soil moisture levels have progressively dropped through October (Figures 5 - 10). With most areas of the region being near average for this time of year. There is approximately 25 mm of deficit for the region. The small spikes during the month are lined up with the sporadic rainfall that fell in October. The decreasing trend is likely to continue unless there is significant rainfall in the coming months.
The soil moisture deficit is calculated based on incoming daily rainfall (mm), outgoing daily potential evapotranspiration (mm), and a fixed available water capacity (the amount of water in the soil 'reservoir' that plants can use) of 150 mm (NIWA).
River flow
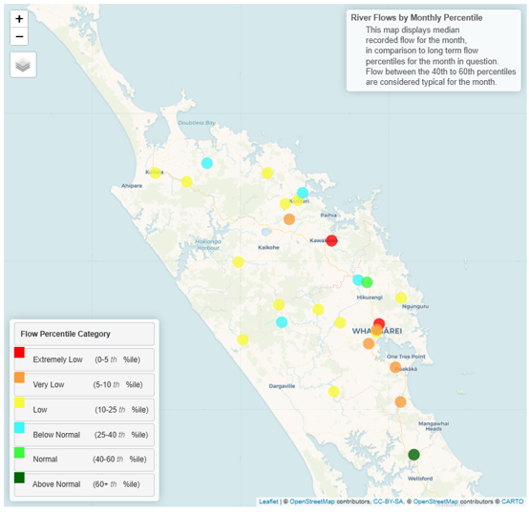
The on going scattered rainfall continues to drive the lower than expected October river flows across Northland (Figure 11). Majority of catchments recorded either “Below normal” “low” or “Very Low” flows. With areas around Kawakawa and Whangarei “Extremely Low”. Most river flows will be lower than normal if rainfall continues to be below average. All monitored river flows are currently above MALF (Mean Annual Low Flow).
Monthly percentile River Flows for October 2024
Groundwater
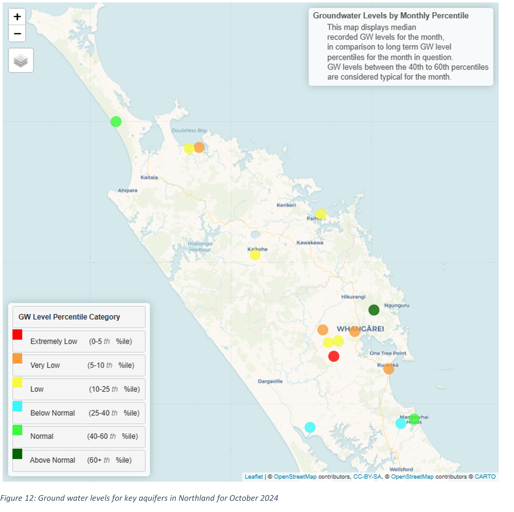
Groundwater levels across the majority of Northland are lower than expected (Table 1). Predominantly driven by low rainfall through 2024. Variation to this is only seen in three key catchments, the Aupōuri Peninsular and Mangawhai recorded “normal” water levels for October, while the Glenbervie aquifer is “above normal” for October (Figure 12). Levels are likely to continue to be lower than expected unless rainfall begins to increase.
| Aquifer | Status | Percentile |
| Aupōuri | Normal | 40th - 60th |
| Taipā | Low | 10th - 25th |
| Russell | Low | 10th - 25th |
| Kaikohe | Low | 10th-25th |
| Poroti | Very low | 5th - 10th |
| Whangārei | Very low | 5th - 10th |
| Mangawhai | Normal | 40th - 60th |
| Marsden - Ruakākā | Very low | 5th-10th |
| Ruawai | Below normal | 25th - 40th |
Ground water levels for September 2024
Climate Outlook for November to January 2024
Summary of climate forecasts from NIWA and MetService
While there is still a “La Nina watch” in effect, the likelihood of an event occurring by the end of January has reduced to 53%. If La Nina is declared it is likely to be mild and short lived. The Southern Annular Mode is transitioning back to a positive position, which will cause weakened fronts from the Southern Ocean and result in stable high-pressure systems around New Zealand for the upcoming three months. There is a small likelihood of unsettled weather in Northland at the end of November driven by the Indian Ocean Dipole and the Madden-Julian Oscillation (MJO) working in tandem. The Indian Ocean Dipole (IDO) index moved into negative during October while the Madden-Julian Oscillation is expected to move into the southwest Pacific during November. Both systems are traditionally associated with northerly rain for Northland, and could bring intense rainfall if a tropical weather system develops. The IDO and MJO are expected to transition back to dry conditions in December and January.
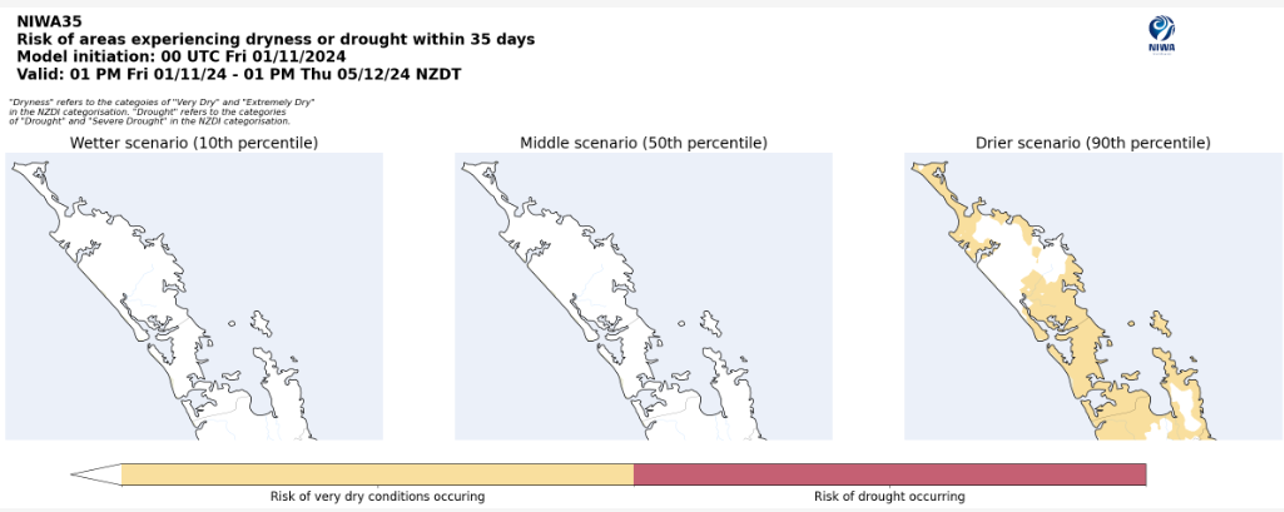
Air temperatures for November 2024 – January 2025 in Northland (Table 2) are expected to be “above average”, while rainfall, soil moisture and river flows are expected to be “near average” or “below average”. There were mild marine heatwave conditions on the west coast of Northland, and coast sea temperature trends suggest that heatwave conditions could intensify heading into summer. The NIWA35 forecasting tool for the period 1 November – 5 December, has a minor risk (90th percentile) for “very dry” conditions in the south and north of Northland (Figure 13).
For more details, please refer to NIWA’s seasonal climate outlook for October - December 2024:
- Seasonal climate outlook on NIWA's website: niwa.co.nz
- Weather email lists on Metservice's website: metservice.com
- The NIWA35 forcasting tool can be re-run every week, and is most reliable for the two weeks after the forecast: NIWA35 forecasting tool
NIWA Temperature, Rainfall, Soil Moisture and River Flows probabilities for the period of November to January 2024
(Expressed as % likelihood for either Above Average, Near Average or Below Average conditions).
| Temperature | Rainfall | Soil moisture | River flows | |
| Above average | 65• | 25 | 20 | 20 |
| Near average | 30 | 40• | 40• | 40• |
| Below average | 05 | 35• | 40• | 40• |
As of 4 November, most of New Zealand has not yet moved into the Dry or lowest category of NIWA’s Drought Index (Figure 14), which is based on the Standardised Precipitation Index, the Soil Moisture Deficit, the Soil Moisture Deficit Anomaly, and the Potential Evapotranspiration Deficit. Parts of the North Islands east coast in Hawkes Bay and Tairāwhiti are now Dry to Extremely Dry.
Tropical Cyclone Outlook
Summary of NIWA and MetService Outlooks
On average at least one ex-tropical cyclone (TC) passes within 550km of New Zealand (NZ) each year. This season the risk is considered normal-elevated (Figure 15). If an ex-TC tracks close to NZ, there is a near equal probability of it racking to the east or west of the North Island. An ex-TC entering the NZ region could produce significant rainfall, severe winds, hazardous marine conditions and coastal damage.

