September 2024 climate report
8 Oct 2024, 10:00 AM
Summary
- La Niña has a 60-70% chance of developing in December.
- Temperatures between October–December are likely to be above average.
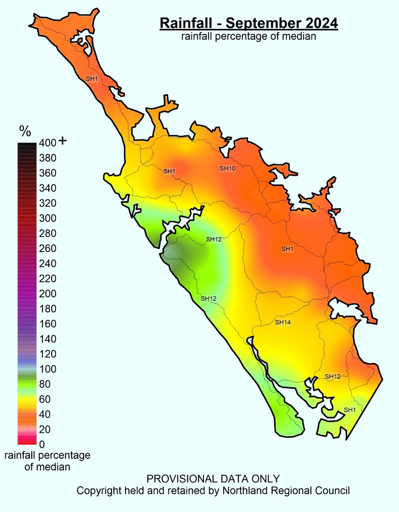
- Rainfall in September was low, with the region on average recording 45% of the expected rainfall.
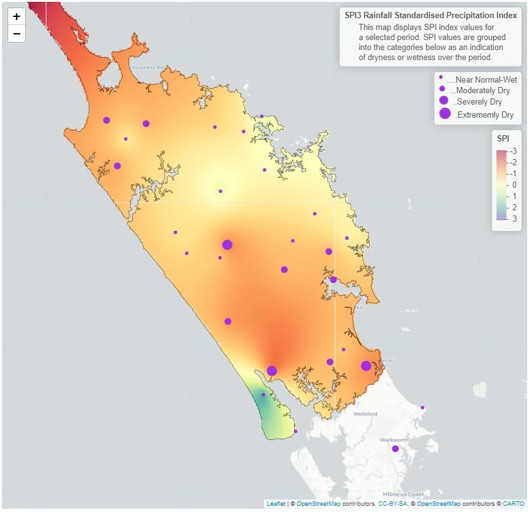
- Standardised rainfall for the last three and 6 months shows the central parts of Northland as drier than expected, while the coasts are “near normal”.
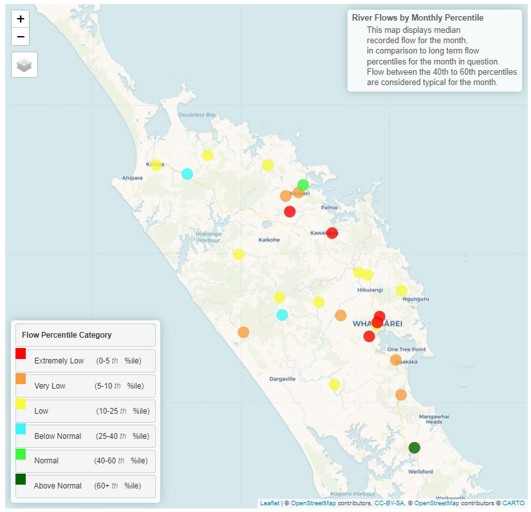
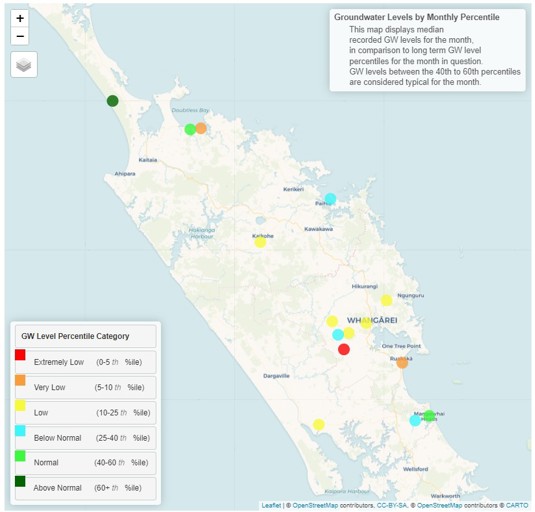
- River flows and groundwater levels in September were generally “low” for the whole region.
- Soil moisture is currently about average for the time of year.
Climate Outlook for October to December 2024
Through September neutral El Niño–Southern Oscillation (ENSO) conditions were recorded, along with strengthening trade winds. These conditions are likely to continue in October, though it is expected that the Southern Oscillation Index will continue to trend towards La Niña, with a 60–70% chance an event being declared in December.
The Southern Annual Mode (SAM), was in a positive state in for the first part of September, causing higher than normal air pressure around New Zealand. The second half of September saw the reverse, with low pressure in the Southern Ocean driving the weather in New Zealand. During October the SAM is predicted to return to positive conditions and continue to strengthen, which is normal in the development of La Niña.
Sea Surface temperatures around New Zealand in September were unusually warm, with marine heatwave conditions developing in Northland. There is a high likelihood that marine heatwave conditions will intensify between October–December, which is often associated with La Niña summers. However, with the likely development of a La Niña summer, it is important to remember that no two events will be alike, and the intensity, and climatic response will vary, particularly with continued above average temperatures recorded globally.
In Northland from October to December “above average” temperatures are expected, while “near average" rainfall, soil moisture and river flows are likely. This forecast has a “Medium-high” confidence for the temperature prediction, while the rainfall prediction has a “low-medium” confidence.
For more details, please refer to NIWA’s seasonal climate outlook for October - December 2024:
NIWA Temperature, Rainfall, Soil Moisture and River Flows probabilities for the period of October to December 2024
(Expressed as % likelihood for either Above Average, Near Average or Below Average conditions).
| Temperature | Rainfall | Soil moisture | River flows | |
| Above average | 55• | 30 | 20 | 20 |
| Near average | 40 | 45• | 45• | 45• |
| Below average | 05 | 25 | 35 | 35 |
Rainfall
September was particularly dry, driven by high pressure with the SAM in a positive position at the start of the month. The end of September saw some rainfall, though no significant events.
On average Northland received 63.5 mm of rainfall, which was 45% of the expected average for September. The majority of rainfall in the region was recorded along the west coast, focused into the Hokianga and Poutō Peninsular. The Maximum rainfall was recorded in Waimamaku with 196 mm, followed by Ōmāpere with 101.5 mm, and the midpoint of the Poutō Peninsular with 83 mm. Percentage wise, Ōmāpere recorded 96% of expected, and both Waimamaku and the Poutō Peninsular 80%.
On the eastern side of Northland, sites were a lot drier, with the Waitangi catchment recording only 38mm which was 28% of expected, the lowest of the month. If the SAM returns to a positive mode as predicted October is likely to have a similar pattern.
Rainfall (% of Median) for September 2024 across Northland with a range of 28% to 96%
Standardised Precipitation index (SPI)
The Standardised Precipitation Index (SPI) has a continued pattern from previous months, where the three-month scale shows that all of Northland has been “near normal or wet”, with more rainfall on the east coast.
However, on a six-month scale, between March – August 2024, the region in general has been moderately dry, which was driven by the very late arrival of autumn rains and El Niño conditions. The Cape Rēinga gauge has got missing data so is displaying incorrect data.
3-month (July - September 2024) and 6-month (April - September 2024) SPI maps
River flow
Following several drier than average months, and sparse rainfall in Northland during September, river flows ranged between “Below Normal” – “Extremely Low” compared to the expected levels at this time of year. There is no obvious pattern of any region or catchment being higher or lower than others.
Monthly percentile River Flows for September 2024
Groundwater
Ground water levels are responding to the continued below normal monthly rainfall amounts over the last six months.
During September the Aupōuri Aquifer recorded “Above Normal” water levels, however the rest of the region was predominantly “Low” or “Below Normal” for September.
| Aquifer | Status | Percentile |
| Aupōuri | Above normal | 60th+ |
| Taipā | Normal | 40th-60th |
| Russell | Below normal | 25th-40th |
| Kaikohe | Low | 10th-25th |
| Poroti | Low | 10th-25th |
| Whangārei | Low | 10th-25th |
| Mangawhai | Below normal | 25th-40th |
| Marsden - Ruakākā | Very low | 5th-10th |
| Ruawai | Low | 10th-25th |
Ground water levels for September 2024
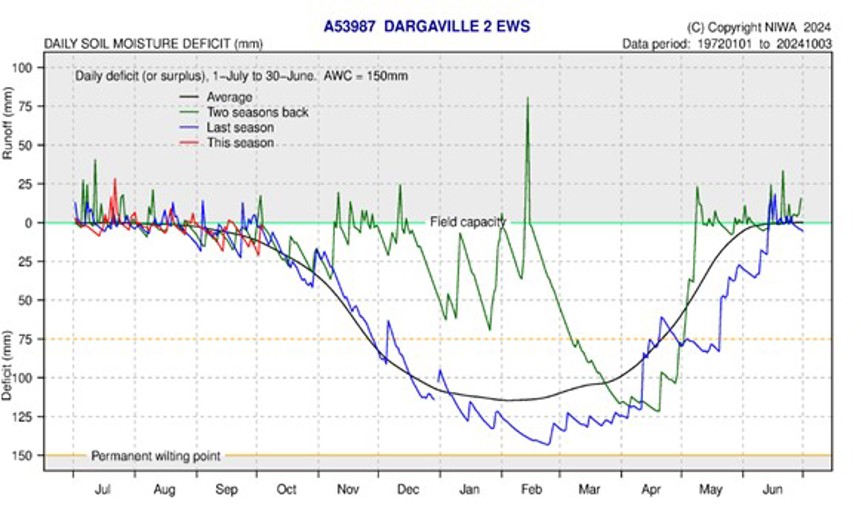
Soil Moisture
September soil moisture levels were generally just below field capacity. A small rain event saw some areas with run off at the start of October.
In general soil moisture is roughly average for the time of year. The soil moisture deficit is calculated based on incoming daily rainfall (mm), outgoing daily potential evapotranspiration (mm), and a fixed available water capacity (the amount of water in the soil 'reservoir' that plants can use) of 150 mm” (NIWA).

