August 2024 climate report
6 Sep 2024, 11:00 AM
Summary
- La Niña watch continues with a 50% chance of an event being officially declared by the end of spring
- Between September to November temperatures are likely to be above average, while rainfall and river flows will be near average
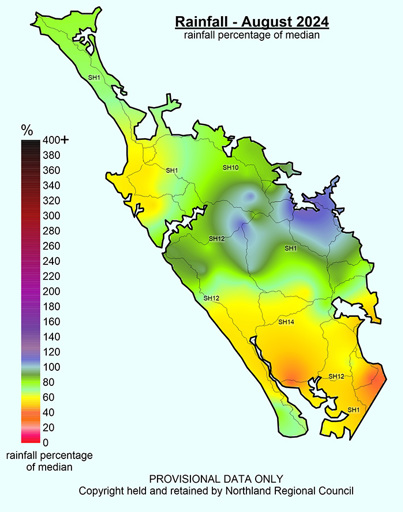
- August rainfall ranged between 40% of the expected in the south west to 120% in the east
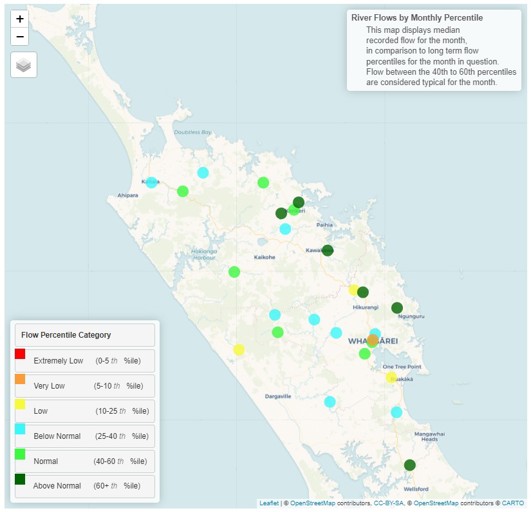
- River levels varied during August with most catchments recording “Below Normal” or “Normal” flows
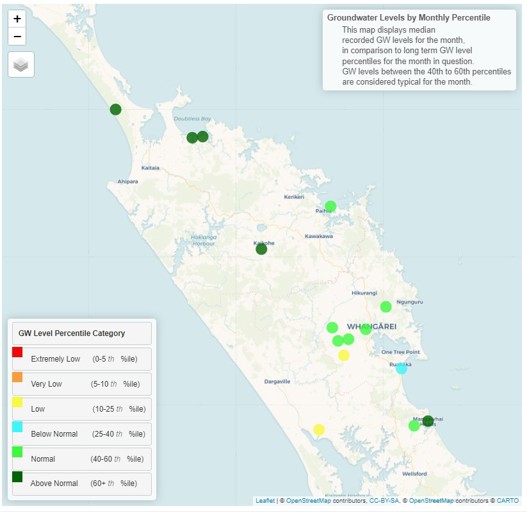
- Ground water levels were generally “Normal”, however Ruakākā and Ruawai were “low” for August
- Soil moisture in August was at or above field capacity across the Rohe, this is likely to continue in September.
Climate Outlook for September to November 2024
La Niña watch continues with a 50% chance of an event being officially declared by the end of spring; the conditions associated with La Niña are likely to be seen at the end of September into November.
The start of September is likely to be dominated by unsettled and windy weather caused by a sudden warming over Antarctica during the winter months (sudden Stratospheric Warming).
In Northland temperatures are modelled to be “Above Average”, while rainfall, soil moisture and river flows are likely to be “near average”.
For more details, please refer to NIWA’s seasonal climate outlook for September - November 2024:
NIWA Temperature, Rainfall, Soil Moisture and River Flows probabilities for the period of September to November 2024
(Expressed as % likelihood for either Above Average, Near Average or Below Average conditions).
| Temperature | Rainfall | Soil moisture | River flows | |
| Above average | 55• | 20 | 25 | 20 |
| Near average | 40 | 45• | 45• | 40 |
| Below average | 05 | 35 | 30 | 40• |
Rainfall
August started with three good days of general rain followed by smaller frontal systems through the rest of the month and ended with more northerly rain and warmer temperatures.
On average Northland received 121 mm of rain during August. This was concentrated in the mid-north and Kerikeri areas which recorded the expected levels for the month.
Other areas were far drier than expected. Percentage-wise, only 40% of expected August rain was recorded at Ruawai and inland of Mangawhai at Tara Road. At the other end of the scale, Ōpua had 120% and Kaikohe 111%.
Rainfall (% of Median) for August 2024 across Northland with a range of 40% to 120%
Standardised Precipitation index (SPI)
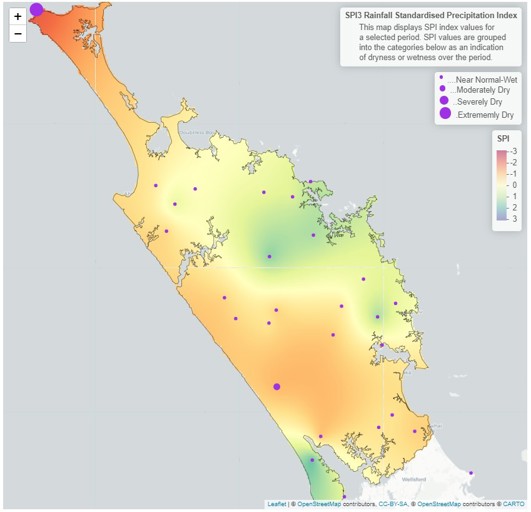
The Standardised Precipitation Index (SPI) has a continued pattern from previous months, where the three-month scale shows that all of Northland has been “near normal or wet”, with more rainfall on the east coast.
However, on a six-month scale, between March – August 2024, the region in general has been moderately dry, which was driven by the very late arrival of autumn rains and El Niño conditions. The Cape Rēinga gauge has got missing data so is displaying incorrect data.
3-month (June - August 2024) and 6-month (March - August 2024) SPI maps
River flow
Northland river flows through August varied greatly with the majority of sites “Below Normal” or “Normal”. The patterns are reflected by the recorded rainfall for the month, with the highest flows on the east coast where about average rainfall was recorded. While the lower flows are in dryer areas.
Monthly percentile River Flows for August 2024
Groundwater
Ground water levels during August were either “Normal” for the time of year or “above Normal”, with the only exceptions in the Ruakākā and Ruawai aquifers, which are currently “Low” and “Below Normal” respectively.
| Aquifer | Status | Percentile |
| Aupōuri | Above normal | 60th+ |
| Taipā | Above normal | 60th+ |
| Russell | Normal | 40th-60th |
| Kaikohe | Above normal | 60th+ |
| Poroti | Normal | 40th-60th |
| Whangārei | Normal | 40th-60th |
| Mangawhai | Above normal | 60th+ |
| Marsden - Ruakākā | Below normal | 25th-40th |
| Ruawai | Low | 10th-25th |
Ground water levels for August 2024
Soil Moisture
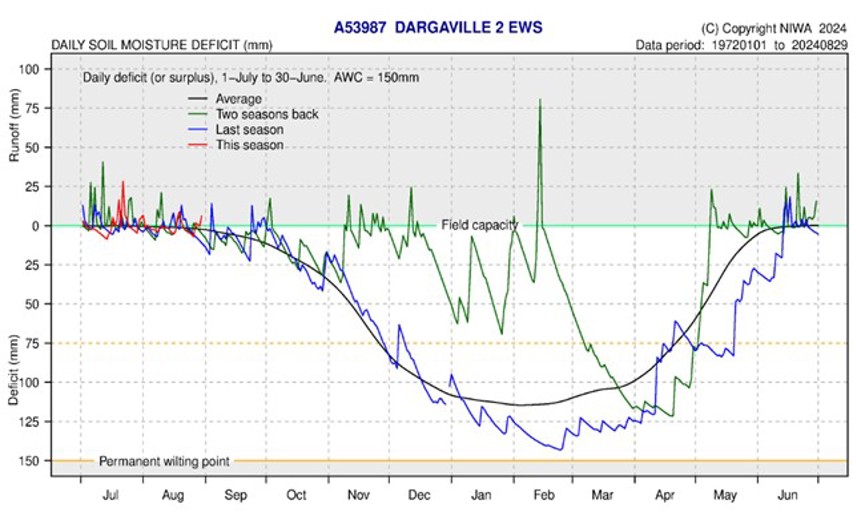
During August, across all modelled sites in Northland soils remained at or above field capacity.
Through September we are likely to see some areas starting to drain, however this depends on the climate conditions passing through during September.
The soil moisture deficit is calculated based on incoming daily rainfall (mm), outgoing daily potential evapotranspiration (mm), and a fixed available water capacity (the amount of water in the soil 'reservoir' that plants can use) of 150 mm” (NIWA).

