January 2025 climate report
10 Feb 2025, 3:00 PM
Key take away from this report
Rain in January has improved conditions for most of the north and east of the region, whereas the south and west remain dry.
Summary
- Northland region averaged 154% of normal expected rainfall for January, however rainfall was primarily concentrated in the north and east, with low rainfall in the southwest.
- River flows in the north and east of the region range from “Normal” to “Low”, whereas in the south and west river flows are generally “Low” to “Extremely Low” for January.
- Groundwater levels for January in Northlands key aquifers are generally “Normal” in the mid and far north, and “Low” to “Extremely Low” in the south.
- Soil moisture levels are well above average in Kaikohe and Kerikeri, close to average in Kaitaia, Whangārei and Warkworth, and below average in Dargaville, for January.
- La Niña has been officially declared; however, the event is expected to be weak and short-lived.
- Temperatures are very likely to be above average (50% chance) over the next three months.
- Rainfall totals are most likely to be above average (40% chance) or average (35% chance) over the next three months.
- River flows are equally likely to be near normal (45% chance) or below average (35% chance) over the next three months.
- Soil moisture levels are equally likely to be average (45% chance) to below average (45% chance) over the next three months.
- The risk of occasional heavy rain events remains distinctly possible, particularly for the northern and eastern North Island.
- Late summer through early autumn is considered to be the peak of the tropical cyclone season. The risk for an ex-tropical cyclone to pass within 550 km of New Zealand is normal-to-elevated through April.
- Conditions for the north and east of Northland have generally improved, following significant mid-January rainfall, and these areas are currently experiencing conditions ranging from near normal to low level meteorological and hydrological drought.
- Southern and western areas of the region are drier and are experiencing moderate levels of meteorological and hydrological drought with low rainfall, low river flows, low groundwater levels, and low soil moisture.
- There is a risk that, if extended periods of low rainfall continue, parts of Northland, particularly in the southwest, could experience an increasing level of meteorological and hydrological drought (with lower river flows, groundwater levels, water reservoirs, and soil moisture etc.,) over the next three months.
Rainfall
The first few weeks of January were generally cloudy with infrequent showers. Temperatures were generally low until the end of the month when temperatures rose into the high 20s. There were two substantial rain events in the second half the month. Both events brought rain primarily to eastern areas of Northland. The highest monthly rainfall totals were recorded in the Kaeo catchment with 319.5mm, 290% of the long-term median (normal expected), at Touwai at Weta station (eastern Kaeo catchment) and 240.5mm, 301% of normal expected, at Kaeo at Bramleys station. The lowest monthly rainfall was recorded in Dargaville with 23.8mm, 28% of normal expected. Northland region as a whole averaged 121mm, 154% of normal expected rainfall for January (Figures 1 and 2).
Figure 1 and 2: January rainfall distribution for Northland in mm, and in percentage of median.


The standardised rainfall index (SPI) is useful to compare the rainfall in Northland as a whole, as the site-specific patterns are removed from the data. On a three-month scale between November – January (Figure 3) the region has recorded “near normal” rainfall, other than the southwestern area of Northland which is “moderately dry”. On a six-month scale from August – January (Figure 4) however, the central and western areas of Northland are much drier than expected. The SPI helps understand the reserves in soil moisture river flow, and how quickly catchments will drain. The extended dry means that the region is likely to drain quicker than expected following rain events.
Figure 3 and 4 : Standardised rainfall for Northland on a 3-month scale (November – January) and a 6-month scale (August – January).


River Flows
Northland's river flows have experienced some recovery in January, following very low flows in December, primarily in northern and eastern catchments where river flows range from “Normal” to “Low” (Figure 5). River flows in catchments in the south and west of the region range from “Low” to “Extremely Low” with some rivers falling back below Mean Annual Low Flow (MALF) in the first week of February. Regional river flow variation generally reflects the months rainfall distribution.
Figure 5: River flows in Northland for January 2025.

Groundwater
Groundwater levels for January in Northland's primary monitored aquifers are split into two distinct patterns (Figure 6). The mid north and far north aquifers are primarily recording “Normal” water levels for the month. While around Whangārei and the south of the region groundwater levels range from “Low” to “Extremely Low” for this time of year.
Figure 6: Groundwater levels in Northland’s primary monitored aquifers for December.

Soil moisture
Other than the west coast, all the sites where soil moisture is calculated in Northland responded to the mid-January rain events (Figure 7). There was a sustained response in Kaikohe and Kerikeri where field capacity was reached and moving into February soils are still holding moisture supporting plant growth (greater than 75 mm of deficit). Whangārei, Kaitaia and Warkworth responded to rainfall in the month but have fallen below the temporary wilting point for most plants. The west coast site at Dargaville has seen no rise in soil moisture and plant distress is likely to be occurring (browning of pasture, slow or no plant growth, wilting etc). The soil moisture deficit is calculated based on incoming daily rainfall (mm), outgoing daily potential evapotranspiration (mm), and a fixed available water capacity (the amount of water in the soil 'reservoir' that plants can use) of 150 mm” (NIWA).
Figure 7: Calculated daily soil moisture values at key areas around Northland, courtesy of NIWA, data ending 31st January 2025.


Climate Outlook for January – April 2025
Summary of climate forecasts from NIWA and MetService
Between February and April New Zealand can expect weak La Nina conditions, with NIWA officially declaring La Nina conditions met in the Pacific Ocean, however it is not expected to be long lasting, with a 50% chance of a watch remaining in force until April. Winds will be mostly from the northeast and bring above normal temperatures and near normal rainfall during the next three months (Table 1). The risk of occasional heavy rain events remains distinctly possible, particularly for the northern and eastern North Island.
Sea Surface temperatures were lower than expected in Northland during January, however these are predicted to increase again in February, increasing the chance of heavy rainfall if a system does develop.
For more information visit the following links:
Table 1: Forecasted likelihood of above, near or below average climate conditions for Northland from February – April 2025.
(Expressed as % likelihood).
| Temperature | Rainfall | Soil moisture | River flows | |
| Above average | 50• | 40• | 10 | 20 |
| Near average | 35 | 35• | 45• | 45• |
| Below average | 15 | 25 | 45• | 35• |
NIWA Drought Index
On 31 January 2025, the NIWA Drought Index (NZDI), categorised the east coast of Northland as “Dry”, the north and central areas of the region as “Very Dry”, and Poutō Peninsula and surrounding areas in the southwest as “Extremely Dry” (Figure 8). The index is based on the Standardised Precipitation Index, the Soil Moisture Deficit, the Soil Moisture Deficit Anomaly, and the Potential Evapotranspiration Deficit, with a value less than 0.75 considered normal – wet. Compared to the report at the beginning of January, the overall drought index track has peaked or stabilised, in all three districts in Northland, potentially indicating a plateau of dry conditions and improvement as we start to move into autumn (Figure 9).
Figure 8: NIWA New Zealand Drought Index produced 31 January 2025.

Figure 9: NIWA drought index tracking for the Far North, Whangārei and Kaipara districts from 2018 - 2025
NIWA35 Forecasting Tool
NIWA’s drought prediction tool combines rainfall, soil moisture, and evapotranspiration to estimate the risk of meteorological drought, over the next 35 days.
The forecast from 31/1/2025 to 6/3/2025 predicts a low risk of “very dry” (90th percentile) conditions in the southwest of the region (Figure 10).
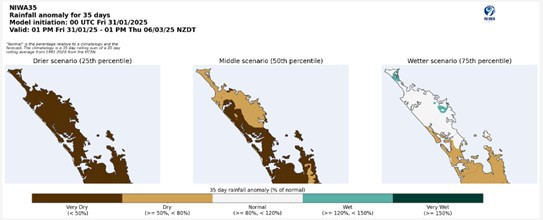
The rainfall prediction for the region for the same time period is that Northland will most likely be dry to very dry (50th percentile), receiving 50 – 80% of the expected rainfall for February, with some areas receiving less than 50% (Figure 11).
The NIWA35 forecasting tool can be rerun every week, and is most reliable for the two weeks after the forecast: NIWA35 forecasting tool at shiny.niwa.co.nz
Figure 10: Drought risk assessment for Northland from NIWA35 from January 31st. There is low risk of dry conditions in the southwest (90th percentile).
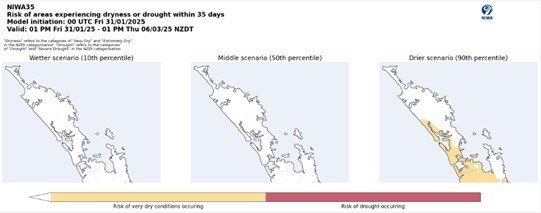
Figure 11: Rainfall prediction for Northland from NIWA35 from January 31st. There is a moderate risk of dry to very dry conditions (50th percentile).
Northland Drought Risk Assessment
The drought risk assessment (Table 2) provides a visual summary of the current conditions of Northlands rainfall, river flows, and groundwater levels and the current state of water resources. It also incorporates NIWA’s Climate Outlook and Drought Index, and MetService Forecasts.
Northland region as a whole received 154% of normal expected rainfall in January, however this follows a very dry December, and was primarily concentrated in the north and east, with the southwest receiving much less, particularly around Dargaville.
River flows and groundwater levels are “Low” in the southern half of the region. There has not been a sustained recovery in river catchments due to prolonged low rainfall and soil moisture levels during spring and summer.
Soil moisture levels are well above average in Kaikohe and Kerikeri, close to average in Kaitaia, Whangārei and Warkworth, and below average in Dargaville, for January.
NIWA’s climate outlook for the next three months predicts that rainfall will most likely be above average to average, and river flows and soil moisture are most likely to be average to below average.
Conditions for the north and east of Northland have generally improved, following significant mid-January rainfall, and these areas are currently experiencing conditions ranging from near normal to low meteorological and hydrological drought. Southern and western areas of the region are drier and are experiencing moderate levels of meteorological and hydrological drought with low rainfall, low river flows, low groundwater levels, and low soil moisture. There is a risk that, if extended periods of low rainfall continue, parts of Northland, particularly in the southwest, could experience an increasing level of meteorological and hydrological drought (with lower river flows, groundwater levels, water reservoirs, and soil moisture etc.,) over the next three months.
Table 2: Drought Risk assessment matrix.
| Current conditions | Extreme | Very low | Low | Normal | High | Very high | Extreme |
| Rainfall | |||||||
| SPI maps | |||||||
| River flows | |||||||
| Groundwater levels | |||||||
| Soil moisture | |||||||
| Water resources current state | |||||||
| NIWA 3-month outlook | |||||||
| NIWA drought index | |||||||
| MetService December forecast |
Tropical Cyclone Outlook
Summary of NIWA and MetService Outlooks
Late summer through early autumn is considered to be the peak of the tropical cyclone season.
On average at least one ex-tropical cyclone (TC) passes within 550km of New Zealand (NZ) each year (Figure 12). This season the risk is considered normal to elevated through April.
If an ex-TC tracks close to NZ, there is a near equal probability of it tracking to the east or west of the North Island. An ex-TC entering the NZ region could produce significant rainfall, severe winds, hazardous marine conditions and coastal damage.
Figure 12: Number of predicted named tropical cyclones interacting with an island group for the 2024-25 season.

